Earth Day 2021: Innovating for Our Communities and the Planet
April 22, 2021 – Science Technology and Innovation Group
Earth Day is an annual worldwide event focused on preserving a healthy, sustainable habitat for people and wildlife alike—and a day that holds special meaning for us at Anchor QEA. Driven by a unifying commitment to our mission, our staff members are continually looking for ways to improve the environment and our communities. The Science, Technology, and Innovation Group (STING) is an internal team dedicated to exploring new methods, tools, and technologies that can add value for our clients and benefit the planet. In celebration of Earth Day—and the work the group is pushing forward—we have collected a handful of STING’s recent innovations to share here with you. Enjoy!
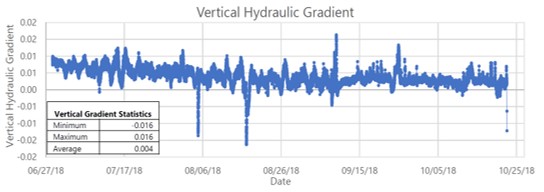
Advanced, Long-Term Porewater Seepage Measurements
Designing successful sediment remedies requires accurately quantifying porewater seepage rates. Short-term seepage measurements do not record important temporal variations due to seasons, storms, or tides. But long-term measurements require not only in-water piezometers that must be protected from vessels and other hazards but also accurate, paired hydraulic conductivity data. To meet these challenges, we pioneered the use of underwater piezometers, which have minimal risk of damage and do not interfere with waterways, and an innovative method to measure co-located hydraulic conductivity in the field using fresh sediment cores. The result is greatly improved ability to fully characterize seepage and enhance sediment remedies.

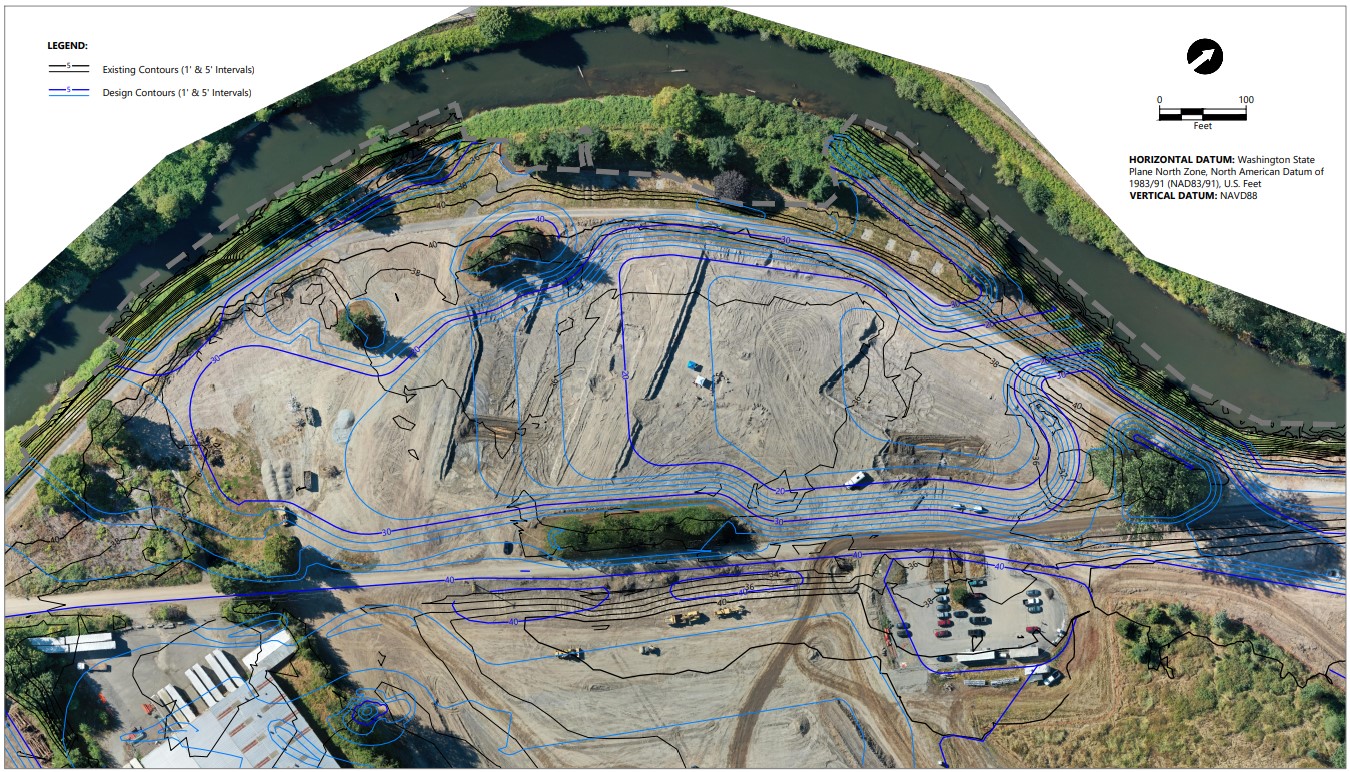
Drone Technology and Aerial Mapping
Anchor QEA’s teams use the latest in drone technology to take photos, record videos, and prepare aerial maps for environmental improvement projects. Because our aerial maps are geolocated and drawn to scale, we can accurately overlay design elements like those shown here for the Lower Russell Levee Setback, a flood protection and river habitat improvement project in Kent, Washington. The visuals these drones provide help with quality assurance, construction progress tracking, and stakeholder communication.
Measuring Ebullition Mass Flux with Advanced Visual Tools
When microbes produce gas in underwater sediment that contains oily materials, the gas bubbles to the surface and produces unsightly sheens. Our teams have extensive experience eliminating those sheens, and to hone our remedial designs, we developed a cost-effective approach to measure sheen production rates. This approach relies on drones using innovative video and GIS methods to select high-quality data-collection locations and analyzing sheen samples to estimate sheen mass.

New Distribution Layer for Sediment Capping
A key cost factor in sediment reactive caps is having sufficient reactive media to address the approximate worst-case contaminant mass flux. Our team developed an approach to cap design that significantly reduces the peak contaminant flux and, hence, the remedy’s overall cost. The technique employs a high-permeability distribution layer below the reactive sediment cap, and modeling indicates it has significant cost-saving implications for future projects.

The Construction Verification Automated Workflow Tools
Our Construction Verification Automated Workflow Tools streamline data processing for sediment remediation compliance analyses related to dredging and capping. Created using Python and ArcGIS software, these tools automatically link complex series of data to efficiently produce high-quality, detailed figures and summary tables that enable project managers and clients to make real-time decisions during construction. Data processing that once took several hours is now done in a matter of minutes, saving time, and virtually eliminating human error.

PFAS and Precursor Models
Another important area of our research aims to understand the conditions under which PFAS precursors may be important to human health and the environment. As part of this effort, we have developed a suite of mechanistic models that integrate information from field and laboratory PFAS studies. These include a bioaccumulation model, a coupled sediment and surface water fate and transport model, and a groundwater fate and transport model. You can read more about this work in our blog posting “Addressing PFAS in the Environment.”

Geographic Information Systems Portal
High-quality geospatial technology and analysis is an integral part of nearly every environmental services project we undertake, enabling project teams to synthesize, analyze, and visualize complex data based on the common language of geography. Interactive Geographic Information System (GIS) portals and story maps satisfy mandates for increased transparency, build the planning capacity of government agencies, better engage stakeholders, and empower informed decision making. You can read more about the benefits of GIS story maps in the Anchor QEA blog “A Tool to Engage and Empower.”

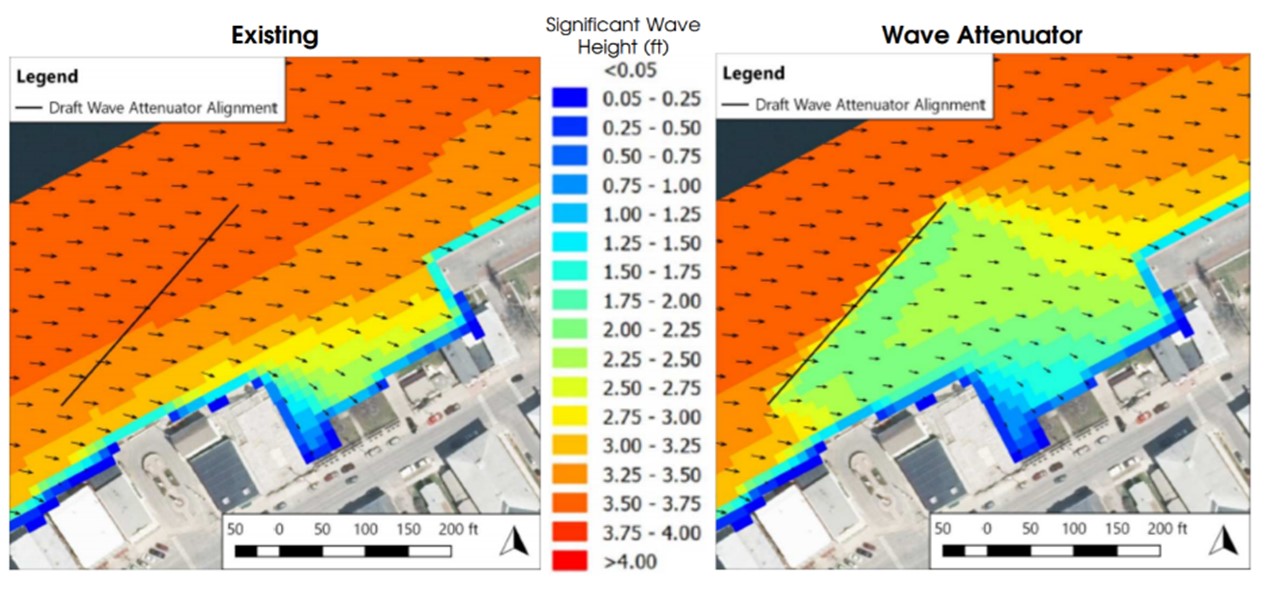
Wave Attenuation Structure
Our wave attenuation structure assesses wave conditions and creates color flood maps which are used to upgrade marinas, docks, and other coastal structures. The offshore device measures and represents the varying wave heights in the flood maps so that communities can both adapt and prepare more successfully for changing conditions.
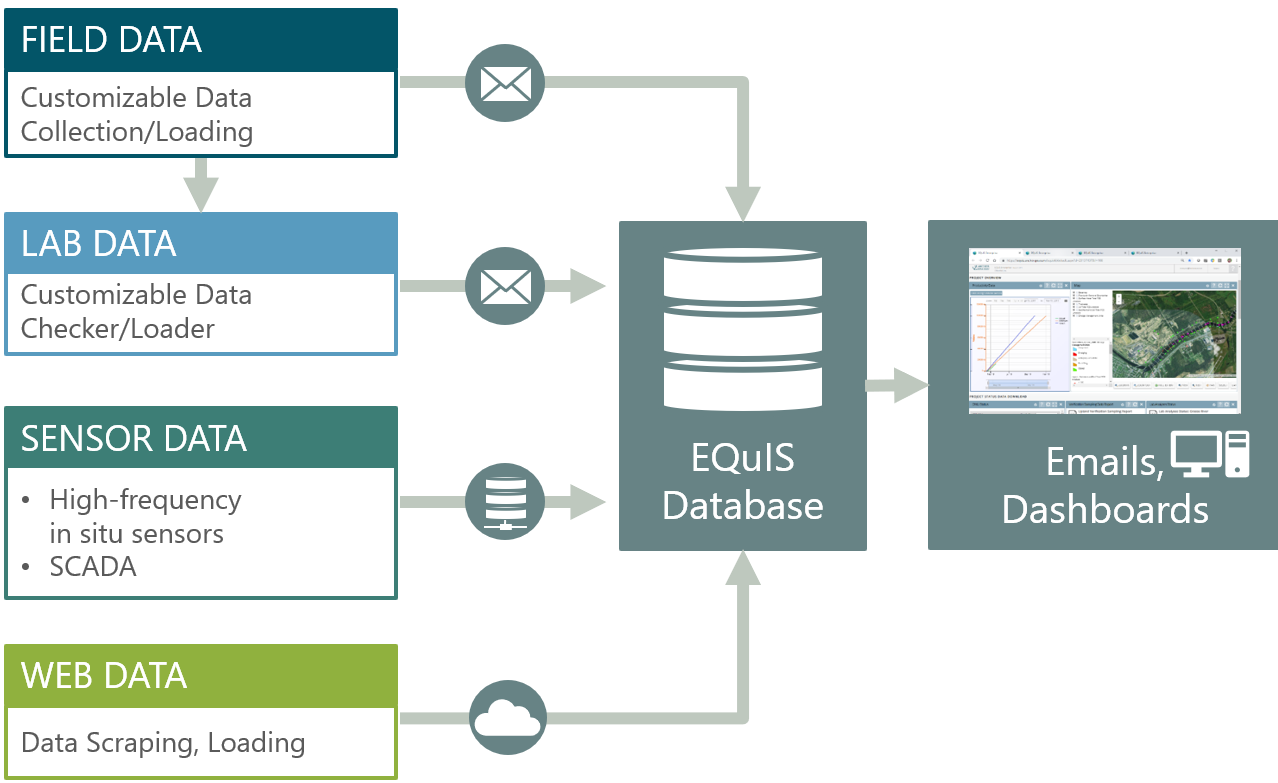
EQuIS Enterprise Development
Our team has added to the EQuIS Enterprise data management system we use features that provide greater quality control and even more efficient data workflows. Among these enhancements are a customized automated laboratory data loader that enforces strict formatting and accurate reporting and an application that validates chemistry data for use in data quality assessments. By setting data management standards, writing procedures that run automatically, and incorporating data quality checks, we have streamlined workflows while providing high-quality data products.
CAD 3D Modeling
Computer Aided Design (CAD) helps our engineers develop, modify, and optimize project designs by providing accurate representations of current site conditions and by projecting the impacts of remedial solutions and of small or large modifications to them. We use CAD outputs in construction plans and as figures in reports, permit applications, and other documents.
By using vector data, high-precision construction documents, 3D TIN (triangular irregular networks) surfaces and grading, and cross sections, all participants in a project can immediately recognize impacts, easily adapt to changes, and ultimately increase productivity. Our teams also provide Cover Design Documents that include location and vicinity maps to aid in decision making.


Thank you to our contributing members—and to the whole STING team—for all that you do for our clients and the planet.
Mike Gefell ● Jill Oliver ● Kevin Russell ● Mark LaRue ● Paul LaRosa ● Mark Meyers ● Tom Griga ● David Glaser ● Daniel Opdyke ● Adam Carlson ● Chris Gardner ● Adrianne Constant ● Paul Sciaba